ES
ES
 PT
PT
 FR
FR
Ag Analytics: How to lead your farm with real-time data (No Excel)
How often do you have to wait until the 20th of the following month to know if your last harvest was profitable? Running a modern farm like that is like driving down the highway looking only at the rearview mirror.
The reality for many US agribusinesses is that they are "Data Rich, but Insight Poor." You have precision ag systems in the field, payroll software in HR, and an ERP in finance. But when the CEO asks a simple question about Net Margin per Block, the answer takes days. Why? Because the data is trapped in spreadsheets.
The "Frankenstein Report" Syndrome 🧟♂️
The traditional reporting process is painful. You likely have an analyst dedicating 80% of their week to downloading CSVs from three different systems, cleaning them, and pasting them into a master Excel file.
The cost of operating with Excel:
- Version Control: "Which one is the right one? 'Final_Report_v2' or 'Final_Report_v3_Corrected'?"
- Human Error: A broken formula can hide a massive cost overrun in a specific block.
- Dead Information: By the time the report is ready, the window to correct the issue in the field has closed.
Native Analytics vs. Patchwork BI
Many believe they need to hire expensive Business Intelligence (BI) consultants to build dashboards on top of their data. Hispatec's philosophy is different: Intelligence should be native. ERPagro already integrates Field, Finance, HR, and Sales into a "Single Source of Truth."
Your New Command Center
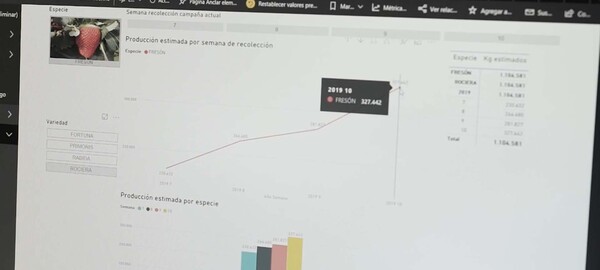
Imagine opening your Real-time Dashboard on your iPad and seeing this:
From "Autopsy" to "Prediction"
A robust management system allows you to scale through three levels of intelligence:
1. Descriptive Level (What happened?)
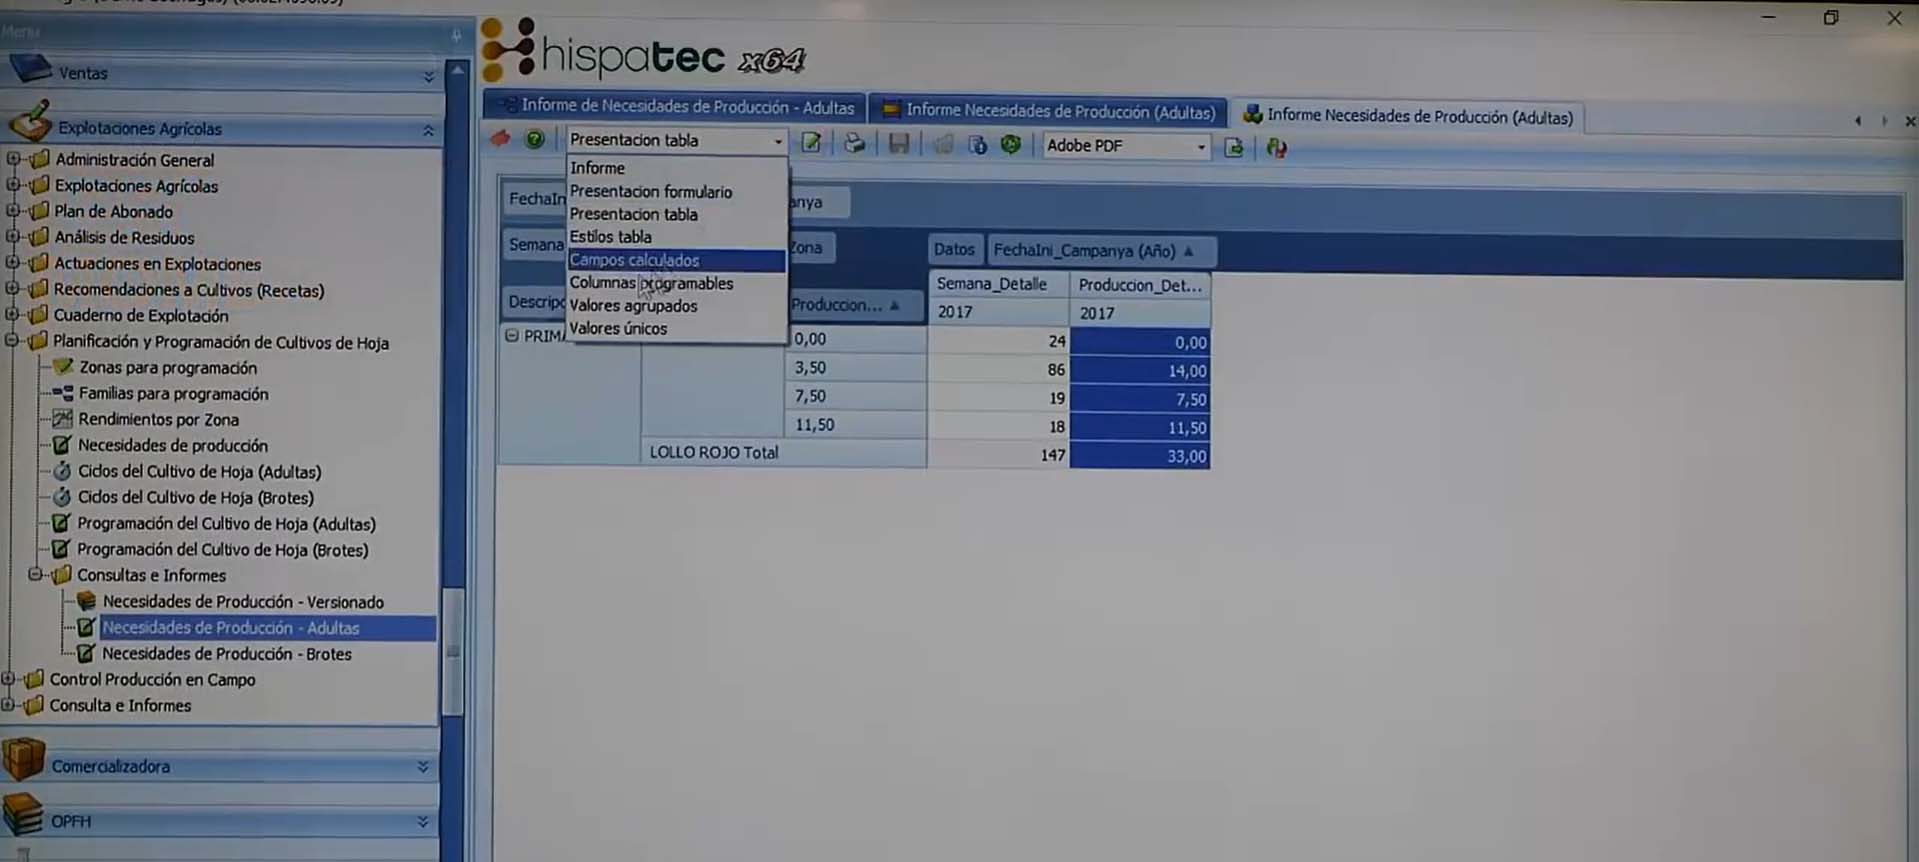
Basic reporting. Sales, costs, and payroll. ERPagro generates these automatically at the end of the day.
2. Diagnostic Level (Why did it happen?)
Drill-down capability. If labor costs spike, click to see which Ranch. Click again to see which Crew. Click again to see if it was H-2A overtime. Find the root cause in seconds.
3. Strategic Level (What do we do?)
Forecasting. Which variety performs best in this specific micro-climate? Which customer yields the best Net Return after freight and deductions? Decisions become mathematical.
Traditional vs. ERPagro Management
| Variable | Spreadsheet Management 📉 | ERPagro Analytics 📈 |
|---|---|---|
| Source of Truth | Multiple scattered files | Single Centralized Database |
| Response Time | Days (Analyst dependent) | Immediate (Self-service) |
| Data Confidence | Low (Formula errors) | High (Transaction Traceability) |
| Executive Focus | Operational ("Putting out fires") | Strategic ("Profitability") |
Is your farm ready for Analytics?
To reach this level, you need operational discipline:
- ✅ Digitalize the Source: If data enters on paper, you've lost. Use Mobile Apps in the field.
- ✅ Integrate, don't Isolate: Finance and Field must share the same data structure.
- ✅ Define KPIs: Don't measure everything. Choose the 5 indicators that drive your business.
FAQ
Not at all. ERPagro's Dashboards are visual and intuitive. If you can read your car's dashboard, you can interpret our dashboards.
Yes. While ERPagro has native analytics, our database is open. We can feed your corporate PowerBI or Tableau dashboards effortlessly.
Stop guessing and start knowing
Take control of your farm with reliable, real-time insights.
See Analytics Demo